Trusted Worldwide Questions & Answers
Most Recent Atlassian ACP-610 Exam Dumps
Prepare for the Atlassian Managing Jira Projects for Data Center and Server Certification exam with our extensive collection of questions and answers. These practice Q&A are updated according to the latest syllabus, providing you with the tools needed to review and test your knowledge.
QA4Exam focus on the latest syllabus and exam objectives, our practice Q&A are designed to help you identify key topics and solidify your understanding. By focusing on the core curriculum, These Questions & Answers helps you cover all the essential topics, ensuring you're well-prepared for every section of the exam. Each question comes with a detailed explanation, offering valuable insights and helping you to learn from your mistakes. Whether you're looking to assess your progress or dive deeper into complex topics, our updated Q&A will provide the support you need to confidently approach the Atlassian ACP-610 exam and achieve success.
The questions for ACP-610 were last updated on Jul 20, 2026.
- Viewing page 1 out of 15 pages.
- Viewing questions 1-5 out of 75 questions
A project administrator wants to modify his project screen.
The project screen meets all the prerequisites for him to be able to edit it.
Which two actions can he perform? (Choose two.}
A project screen is a screen that is used to display or edit issue fields in a project. A project administrator can modify his project screen if it meets the following prerequisites:
The screen is not shared with other projects or issue types.
The screen does not use the default system fields.
The screen scheme and the issue type screen scheme are not shared with other projects or issue types. If these conditions are met, the project administrator can perform the following actions on his project screen:
Create a new tab
Rename a tab
Remove a tab
Add an existing field
Remove a field
Reorder fields The project administrator cannot create a new field, set a default value for a field, or make a field required. These actions require Jira administration permissions.Reference:: https://support.atlassian.com/jira-software-cloud/docs/configure-field-layouts-in-the-issue-view/ https://support.atlassian.com/jira-software-cloud/docs/what-are-issue-fields/
Paul and Tessa are in the Auditors role of every project.
You need to write a JQL query that shows Issues reported by either of them that are still unassigned.
Select the correct JQL query.
You just started working as a scrum master in the Engine team.
The first thing you do is to analyze the Velocity Chart of the team's scrum board as shown
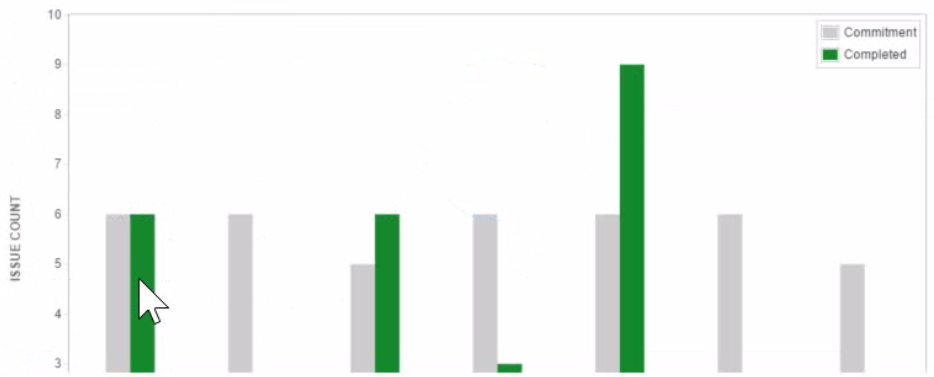
Your team uses Story Points for estimation and tracking.
You performed several actions in the active sprint.
Which two actions are reflected as scope change? (Choose two.)
The two actions that are reflected as scope change are dragging an estimated story from the backlog to the sprint and modifying the estimate value on a committed story. Scope change is a measure of how much work was added or removed from a sprint after it started. It is calculated by comparing the total story points committed at the start of the sprint and the total story points completed at the end of the sprint. If you add or remove issues from a sprint, or change their estimates, you are changing the scope of the sprint. The other actions mentioned in the question do not affect the scope of the sprint, as they do not change the amount of work planned or done in the sprint.Reference: Viewing the Velocity Chart, Scope change
A Jira administrator just created a new project based on the "Task management" project template. Which Jira feature is enabled in this project by default?
Unlock All Questions for Atlassian ACP-610 Exam
Full Exam Access, Actual Exam Questions, Validated Answers, Anytime Anywhere, No Download Limits, No Practice Limits
Get All 75 Questions & Answers