Trusted Worldwide Questions & Answers
Most Recent Microsoft DP-500 Exam Dumps
Prepare for the Microsoft Designing and Implementing Enterprise-Scale Analytics Solutions Using Microsoft Azure and Microsoft Power BI exam with our extensive collection of questions and answers. These practice Q&A are updated according to the latest syllabus, providing you with the tools needed to review and test your knowledge.
QA4Exam focus on the latest syllabus and exam objectives, our practice Q&A are designed to help you identify key topics and solidify your understanding. By focusing on the core curriculum, These Questions & Answers helps you cover all the essential topics, ensuring you're well-prepared for every section of the exam. Each question comes with a detailed explanation, offering valuable insights and helping you to learn from your mistakes. Whether you're looking to assess your progress or dive deeper into complex topics, our updated Q&A will provide the support you need to confidently approach the Microsoft DP-500 exam and achieve success.
The questions for DP-500 were last updated on Jul 20, 2026.
- Viewing page 1 out of 32 pages.
- Viewing questions 1-5 out of 162 questions
You need to meet the technical requirements for deploying reports and datasets to the User Experience workspace. What should you do?
You have an Azure Synapse Analytics workspace that is connected to a data lake.
You train an Open Neural Network Exchange (ONNX) model named Model 1.
You need to implement Model1.
What should you do first?
You have an Azure subscription that contains an Azure Synapse Analytics serverless SQL pool named Pool1.
You plan to deploy a data lake that will record the history of transactions executed against Pool1.
You need to recommend which type of file to use to store the history. The solution must ensure that the history is written in the scope of the related transaction.
Which file type should you recommend?
You have a Power Bl dataset that uses DirectQuery against an Azure SQL database.
Multiple reports use the dataset.
A database administrator reports that too many queries are being sent from Power Bl to the database.
You need to reduce the number of queries sent to the database. The solution must meet the following requirements:
* DirectQuery must continue to be used.
* Visual interactions in all the reports must remain as they are configured currently.
* Consumers of the reports must only be allowed to apply filters from the Filter pane.
Which two settings should you select? Each correct answer presents part of the solution.
NOTE: Each correct selection is worth one point.
Reduce queries
Reduce the number of queries sent by Power BI using the Query reduction settings. For slicers, select the ''Add an Apply button to each slicer to apply changes when you're ready'' option. For filters, select ''Add a single Apply button to the filter pane to apply changes at once (preview).''
You have a dataset that contains a table named UserPermissions. UserPermissions contains the following data.
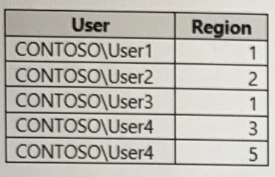
You plan to create a security role named User Security for the dataset. You need to filter the dataset based on the current users. What should you include in the DAX expression?
USERNAME() returns the domain name and username from the credentials given to the system at connection time.
It should be compared to column name of User, which in DAX is expressed through [User].
Unlock All Questions for Microsoft DP-500 Exam
Full Exam Access, Actual Exam Questions, Validated Answers, Anytime Anywhere, No Download Limits, No Practice Limits
Get All 162 Questions & Answers